GENESIS Tutorial 2.1 (2022)
3D structure of biological molecules
Download 3D structure of protein
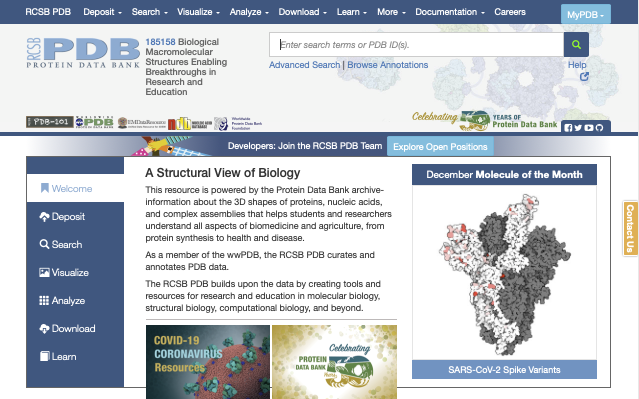
In order to perform MD simulation of a protein, we first need to obtain the 3D structure of the protein. If the structure of the protein you want to study has already been determined by experiments such as X-ray crystallography, NMR, and cryo-electron microscopy (cryo-EM), you can download it from the Protein Data Bank (PDB). Let’s go to the PDB website. A huge number of structures of biomolecules such as proteins and nucleic acids are available from this website.
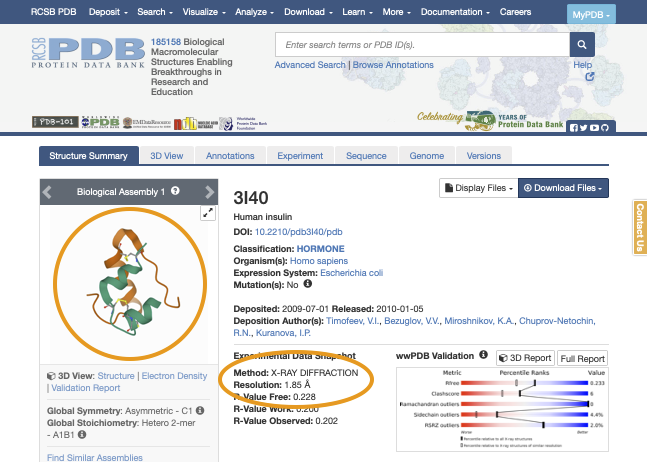
As an example, let’s look for the 3D structure of the “human insulin”. You can search for the protein name in the search box at the top of the page. However, you will find a very large number of entries related to the insulin. For this tutorial, we would like to search one of the representative structures, whose PDB entry is “3I40”. Let’s search for “3I40”. In the page for PDB ID: 3I40, you will see a cartoon figure of the protein on the left side, and also you can see that the structure was determined by X-ray crystallography with a resolution of 1.85 Å.
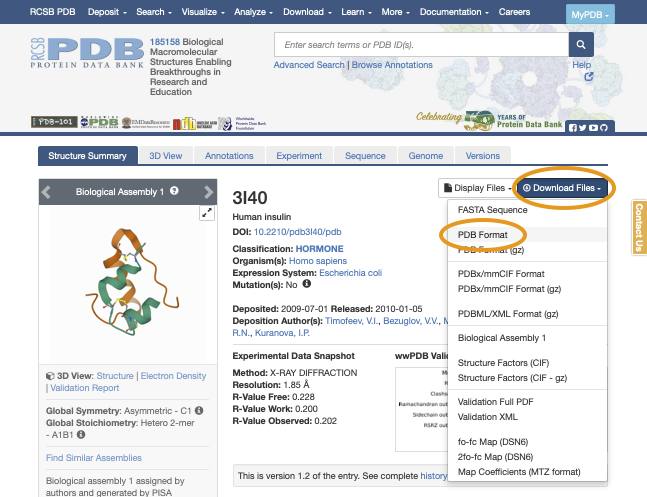
Now, let’s download the structure file of this protein. Such file is called “PDB file”. Click on the “Download Files” button, and then click on “PDB format” to download the file.
Let’s put the downloaded file in the “Data/PDB” directory.
# Download the PDB file to the Data/PDB directory
$ cd ~/GENESIS_Tutorials-2022
$ cd Data
$ cd PDB

$ mv ~/Downloads/3i40.pdb ./
Alternatively, you can quickly download the PDB file using the wget
command. Please right-click on the “PDB format”, select “Copy link
address” from the menu to copy the URL, and then run the wget command
for the copied URL as follows:
# Download the PDB file using the wget command
$ wget https://files.rcsb.org/download/3I40.pdb
Take a look at the PDB file
Let’s take a look at the contents of the PDB file using the less
command. The header part of the file contains various information such
as the resolution of the structure, name of the software used for the
structure refinement, author’s name, and experimental conditions. After
that, there is information about where the disulfide bonds exist, etc.
Then, we can see the X, Y, Z coordinates of each atom in the protein.
The lines starting with “ATOM” are for proteins, and the lines starting
with “HETATM” are for non-protein molecules. In these sections, the 2nd
through 9th columns are the atom index, atom name, amino acid residue
name, chain index, residue number, and X, Y, and Z coordinates,
respectively. For more information about PDB format, please refer to
this page.
# Take a look at the PDB file using the less command
$ less 3I40.pdb

:
REMARK   2 RESOLUTION.    1.85 ANGSTROMS.
REMARK   3
REMARK   3 REFINEMENT.
REMARK   3   PROGRAM     : PHENIX (PHENIX.REFINE)
REMARK   3   AUTHORS     : PAUL ADAMS,PAVEL AFONINE,VICENT CHEN,IAN
:
REMARK 200  EXPERIMENT TYPE                : X-RAY DIFFRACTION
REMARK 200  DATE OF DATA COLLECTION        : 10-MAR-09
REMARK 200  TEMPERATURE           (KELVIN) : 100
REMARK 200  PH                             : NULL
:
:
SSBOND   1 CYS A    6    CYS A   11                            1555   1555  2.03
SSBOND   2 CYS A    7    CYS B    7                            1555   1555  2.04
SSBOND   3 CYS A   20    CYS B   19                            1555   1555  2.04
:
ATOM      1  N   GLY A   1     -27.279   6.238  -12.314   1.00 45.01           N
ATOM      2  CA  GLY A   1     -26.249   6.028  -11.313   1.00 43.47           C
ATOM      3  C   GLY A   1     -25.582   4.677  -11.471   1.00 34.37           C
ATOM      4  O   GLY A   1     -25.731   4.023  -12.501   1.00 30.09           O
ATOM      5  N   ILE A   2     -24.853   4.248  -10.446   1.00 32.71           N
ATOM      6  CA  ILE A   2     -24.070   3.023  -10.550   1.00 22.60           C
ATOM      7  C   ILE A   2     -24.915   1.786  -10.840   1.00 23.32           C
ATOM      8  O   ILE A   2     -24.469   0.865  -11.529   1.00 26.36           O
ATOM      9  CB  ILE A   2     -23.208   2.791   -9.302   1.00 28.24           C
ATOM     10  CG1 ILE A   2     -22.249   1.620   -9.538   1.00 25.03           C
:
HETATM  414  O   HOH A  22     -29.500  -7.696  -14.149   1.00 50.68           O
HETATM  415  O   HOH A  23     -11.374  10.214  -16.391   1.00 40.62           O
HETATM  416  O   HOH A  24     -11.187   9.560  -19.007   1.00 44.09           O
:
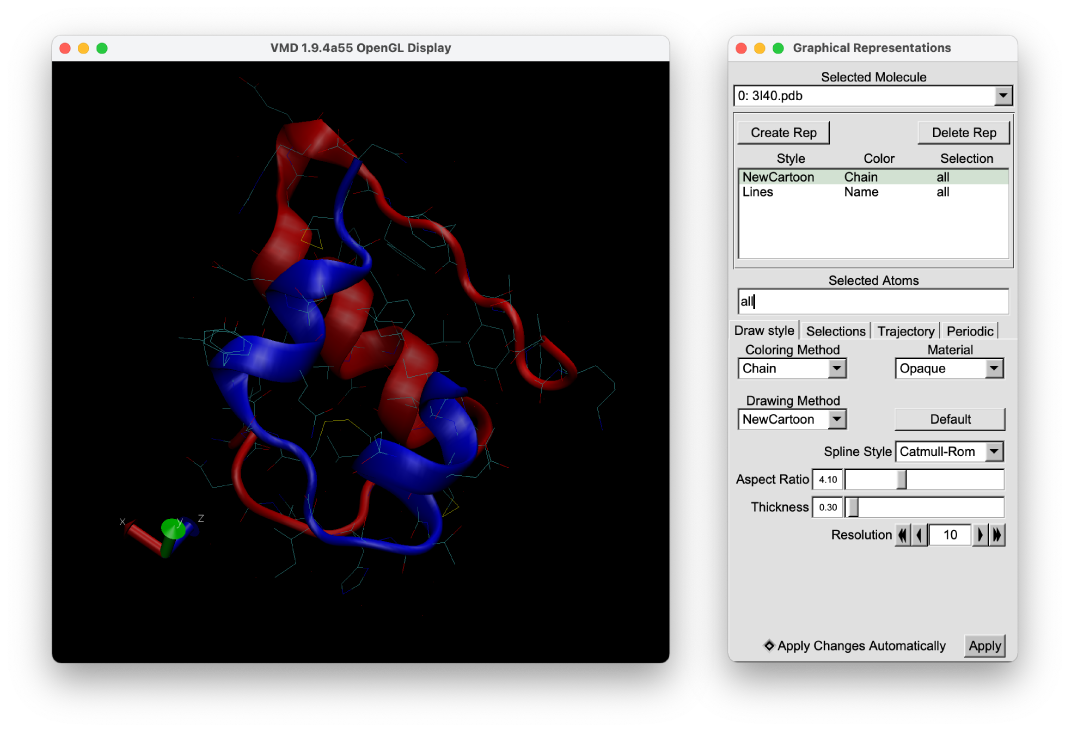
Then, let’s take a look at the PDB structure using VMD. We can see that the protein is composed of two chains, which are connected through three disulfide bonds (Cys6(A)-Cys11(A), Cys7(A)-Cys7(B), and Cys20(A)-Cys19(B)).
# Take a look at the PDB structure using VMD
$ vmd 3I40.pdb
Learn more about PDB structures
Let’s take a closer look at the contents of this PDB file, since this is a good opportunity to learn more about the PDB structure. In this PDB file, we cannot find any hydrogen atoms. This is because in X-ray crystallography it is difficult to capture hydrogen atoms. X-rays are poorly scattered by hydrogen atoms because they have only one electron. On the other hand, if we look at the structure determined by NMR (e.g., PDB ID: 2JV1), we can see hydrogen atoms, and also find many structure models in one PDB file. This is because the NMR structure is modeled based on the information about the distances between nearby hydrogen atoms. In the structure modeling, simulated annealing MD simulations are performed with geometric constraints on the NMR-derived distances and dihedral angles. The multiple models contained in one PDB file represent low energy structures obtained from a large number of simulated annealing MD runs.
Now, let’s go back to the PDB structure of 3I40. Interestingly, if we look at Tyr14, we can see two different conformations A and B, which are called “alternative conformations”. This is presumably because the single conformation could not be determined for this side-chain due to its intrinsic flexibility. If you are going to perform MD simulations using a structure that contains multiple conformers, do not miss it. Probably, you will select one of them in the initial structure modeling. Here, the 10th column next to the Z-coordinate indicates site occupancy of the corresponding atom conformer. If the atom has just one single conformer, this value will be 1. If there are multiple conformers, sum of the occupancy will become 1. Although in the case of Tyr14 in 3I40 both conformers have a value of 0.5, in the other cases the conformer with a higher value may be chosen. For detailed treatment, see Tutorial 5.
:
ATOM     89  CD1 LEU A  13     -11.104  -1.386  -12.388   1.00 18.06           C
ATOM     90  CD2 LEU A  13      -9.522  -1.530  -14.308   1.00 15.25           C
ATOM     91  N   TYR A  14     -13.550   1.075  -15.632   1.00 19.94           N
ATOM     92  CA  TYR A  14     -13.559   2.521  -15.774   1.00 22.72           C
ATOM     93  C   TYR A  14     -14.638   3.140  -14.893   1.00 22.64           C
ATOM     94  O   TYR A  14     -14.391   4.094  -14.152   1.00 25.33           O
ATOM     95  CB ATYR A  14     -13.771   2.911  -17.239   0.50 27.81           C
ATOM     96  CB BTYR A  14     -13.786   2.928  -17.233   0.50 27.85           C
ATOM     97  CG ATYR A  14     -13.608   4.388  -17.494   0.50 28.31           C
ATOM     98  CG BTYR A  14     -13.829   4.427  -17.427   0.50 28.20           C
ATOM     99  CD1ATYR A  14     -12.442   4.893  -18.059   0.50 23.25           C
ATOM    100  CD1BTYR A  14     -12.714   5.121  -17.879   0.50 25.75           C
ATOM    101  CD2ATYR A  14     -14.614   5.282  -17.153   0.50 28.36           C
ATOM    102  CD2BTYR A  14     -14.980   5.152  -17.138   0.50 27.68           C
ATOM    103  CE1ATYR A  14     -12.289   6.252  -18.283   0.50 27.32           C
ATOM    104  CE1BTYR A  14     -12.746   6.496  -18.047   0.50 27.49           C
ATOM    105  CE2ATYR A  14     -14.472   6.636  -17.372   0.50 29.32           C
ATOM    106  CE2BTYR A  14     -15.021   6.527  -17.300   0.50 28.26           C
ATOM    107  CZ ATYR A  14     -13.311   7.117  -17.938   0.50 29.06           C
ATOM    108  CZ BTYR A  14     -13.902   7.193  -17.757   0.50 29.57           C
ATOM    109  OH ATYR A  14     -13.179   8.469  -18.153   0.50 33.01           O
ATOM    110  OH BTYR A  14     -13.938   8.561  -17.922   0.50 32.79           O
ATOM    111  N   GLN A  15     -15.837   2.584  -14.969   1.00 21.27           N
ATOM    112  CA  GLN A  15     -16.962   3.129  -14.222   1.00 21.51           C
:
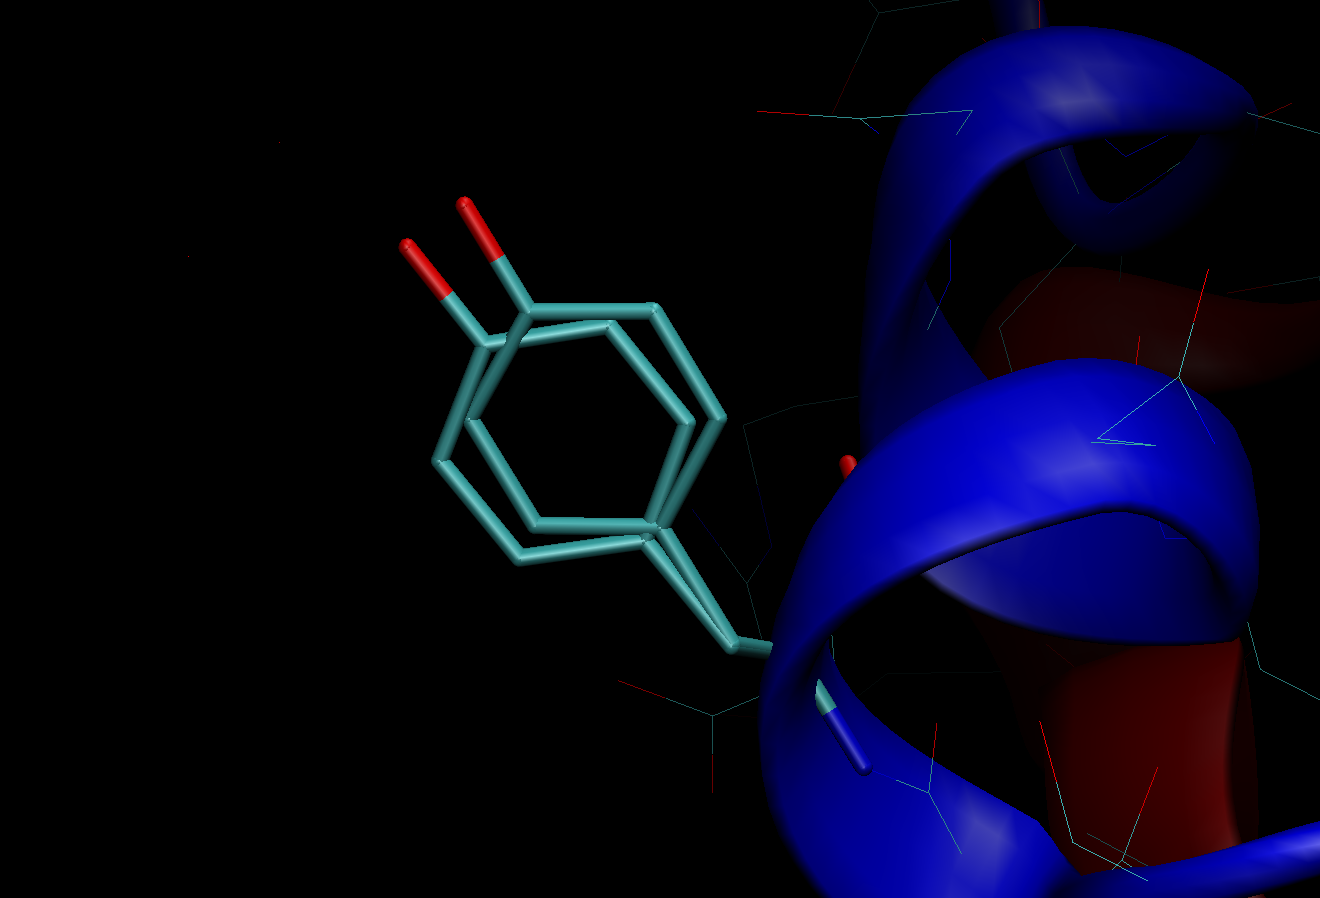
Multiple conformers in the PDB structure
Download PDB files for GENESIS tutorial
In Tutorial 3 and later, we will perform MD simulations for several
selected biomolecules (Protein G, alanine-dipeptide, (Ala)3, etc.) as the common targets. Let’s download
these PDB files from the PDB website to the “Data/PDB” directory by
executing the following commands. Here, alanine-dipeptide and (Ala)3
are small peptides, whose PDB files are actually not available on the
PDB website. You can download them from the GENESIS website, which were
created by us for the purpose of running GENESIS tutorial.
# Move to the Data/PDB directory
$ cd ~/GENESIS_Tutorials-2022
$ cd Data
$ cd PDB

# Download Protein G (PDBID: 2QMT)
$ wget https://files.rcsb.org/download/2QMT.pdb

# (If you have not downloaded genesis_tutorial_materials,
#  refer to tutorial 1.1)
#
# Copy alanine-dipeptide from genesis_tutorial_materials
$ cp ../../genesis_tutorial_materials/ala2.pdb .

# Copy (Ala)3 from genesis_tutorial_materials
$ cp ../../genesis_tutorial_materials/ala3.pdb .
Before moving on to the next tutorial, let’s check the structure of these proteins using VMD.
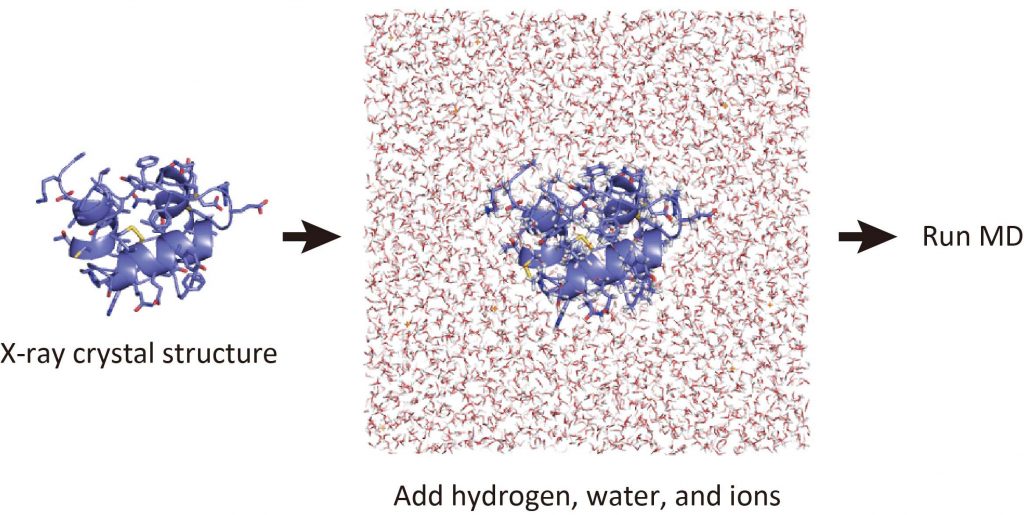
What is needed to run simulations?
Now, we got the 3D structure of the target protein. Some of you may want to run MD simulations of the protein in water. However, the protocol for modeling such a system is very complex. If you are using the X-ray crystal structure for the protein, it is necessary to add hydrogen atoms to the heavy atoms. In addition, you have to place water molecules around the protein to make a water box in the PDB file. The detailed modeling protocol will be explained in Tutorial 2.3, but before that, let’s run through Tutorial 2.2.
Written by Takaharu Mori@RIKEN Theoretical molecular science
laboratory
Dec. 20, 2021